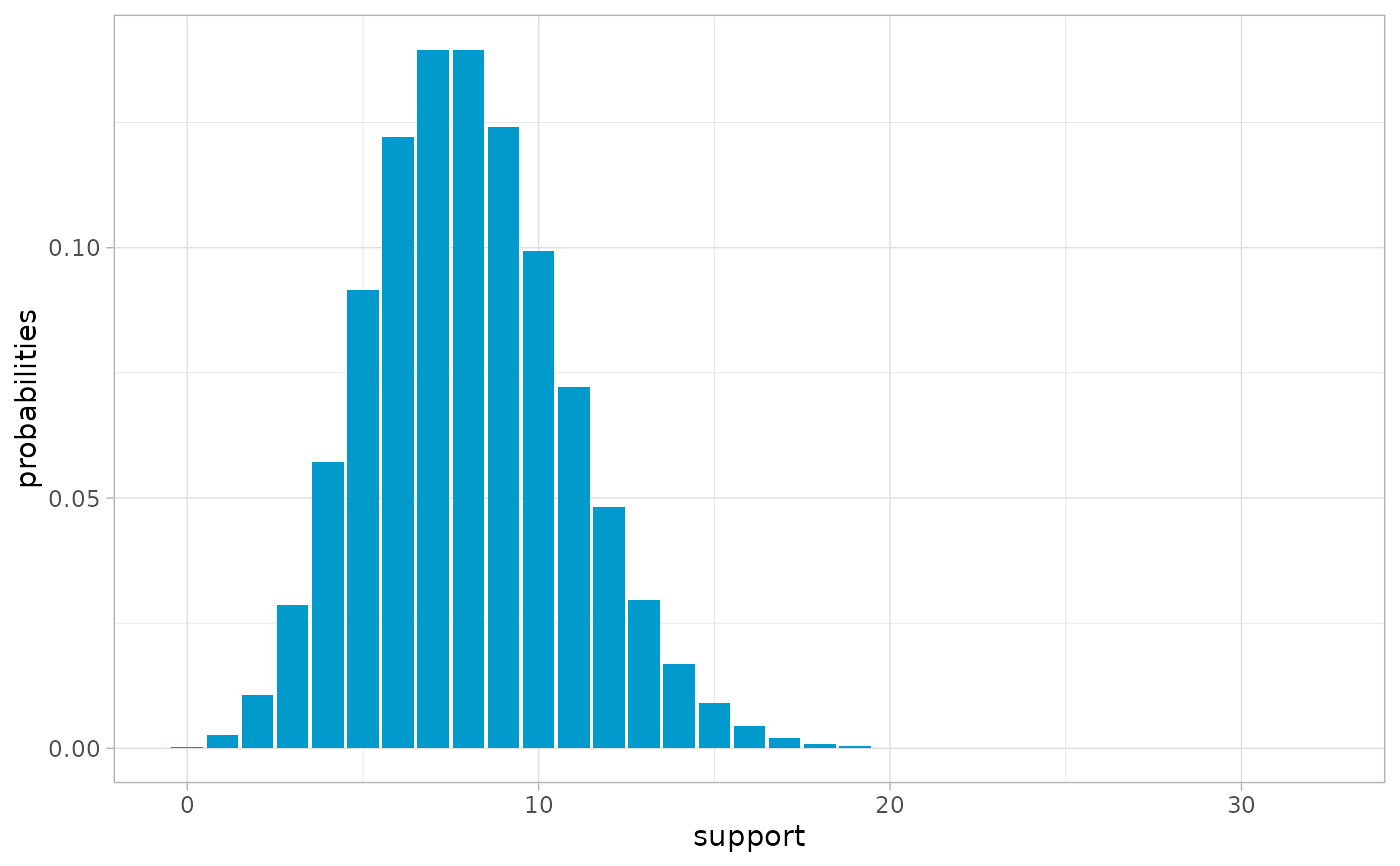
Create a plot of a ddf distribution.
Usage
# S4 method for class 'ddf,missing'
plot(
  x,
  xlab = "support",
  ylab = "probabilities",
  col = "deepskyblue3",
  main = NULL,
  sub = NULL,
  y
)Create a plot of a ddf distribution.
# S4 method for class 'ddf,missing'
plot(
x,
xlab = "support",
ylab = "probabilities",
col = "deepskyblue3",
main = NULL,
sub = NULL,
y
)