Skip to contents

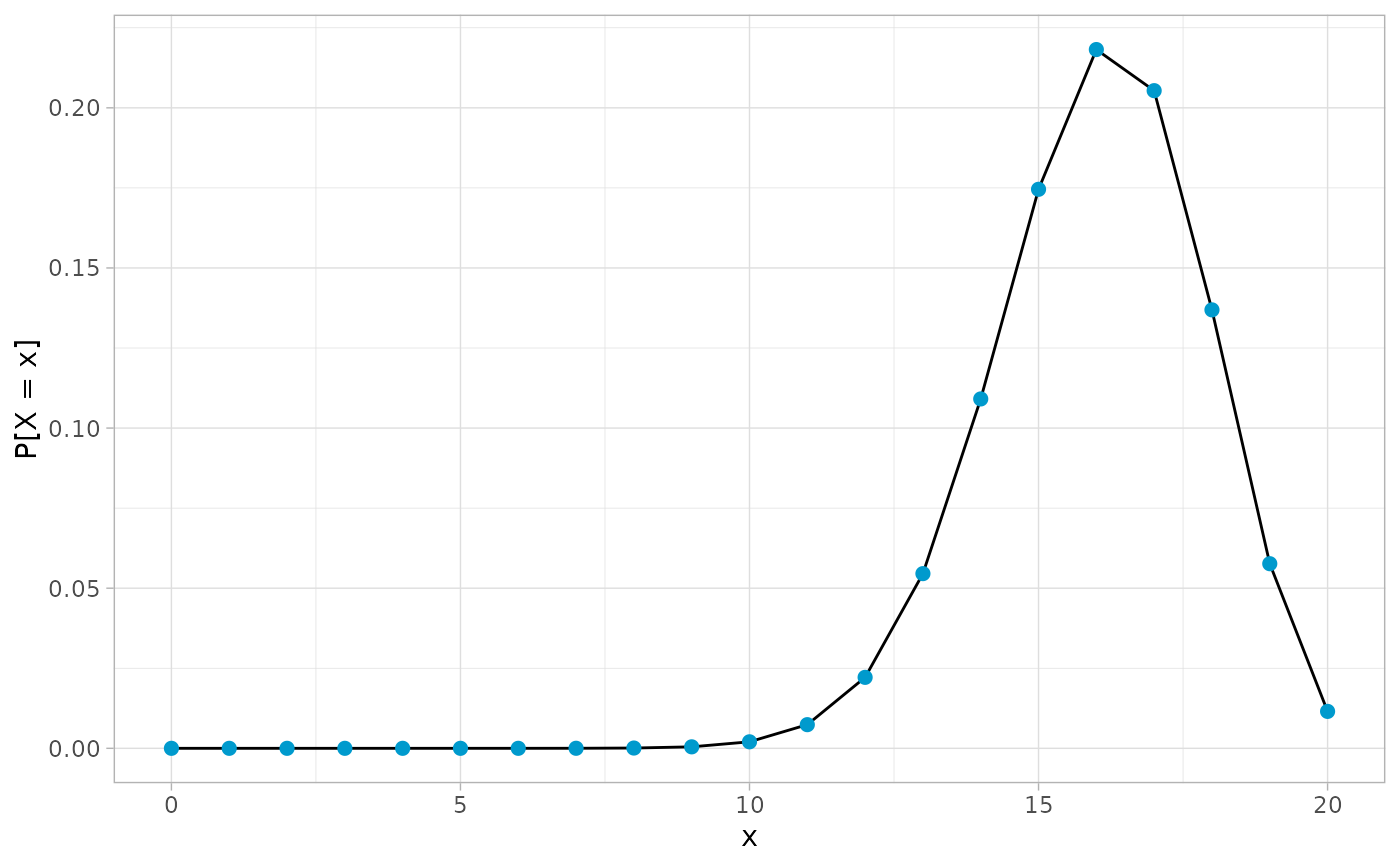
This function creates a plot of the probability mass function of a ddf distribution.

Usage

plot_pmf(
  dist,
  xlab = "x",
  ylab = "P[X = x]",
  col = "deepskyblue3",
  main = NULL,
  sub = NULL
)

Arguments

dist

A ddf object, the distribution.

xlab

The label for the \(x\)-axis.

ylab

The label for the \(y\)-axis.

col

The color for the points of the plot.

main

An overall title of the plot.

sub

A subtitle for the plot.

Value

A ggplot object displaying the PMF of the given distribution.

Details

For further details on the probability mass function, you may consult pmf().

You might also be interested in the generic base::plot() method for ddf objects.

See also

Other plotting functions: plot,ddf,missing-method, plot_cdf()

Examples

# Plot the PMF of a binomial distribution
plot_pmf(bin(20, 0.8))

# A similar plot using the S4 generic
plot(bin(20, 0.8))