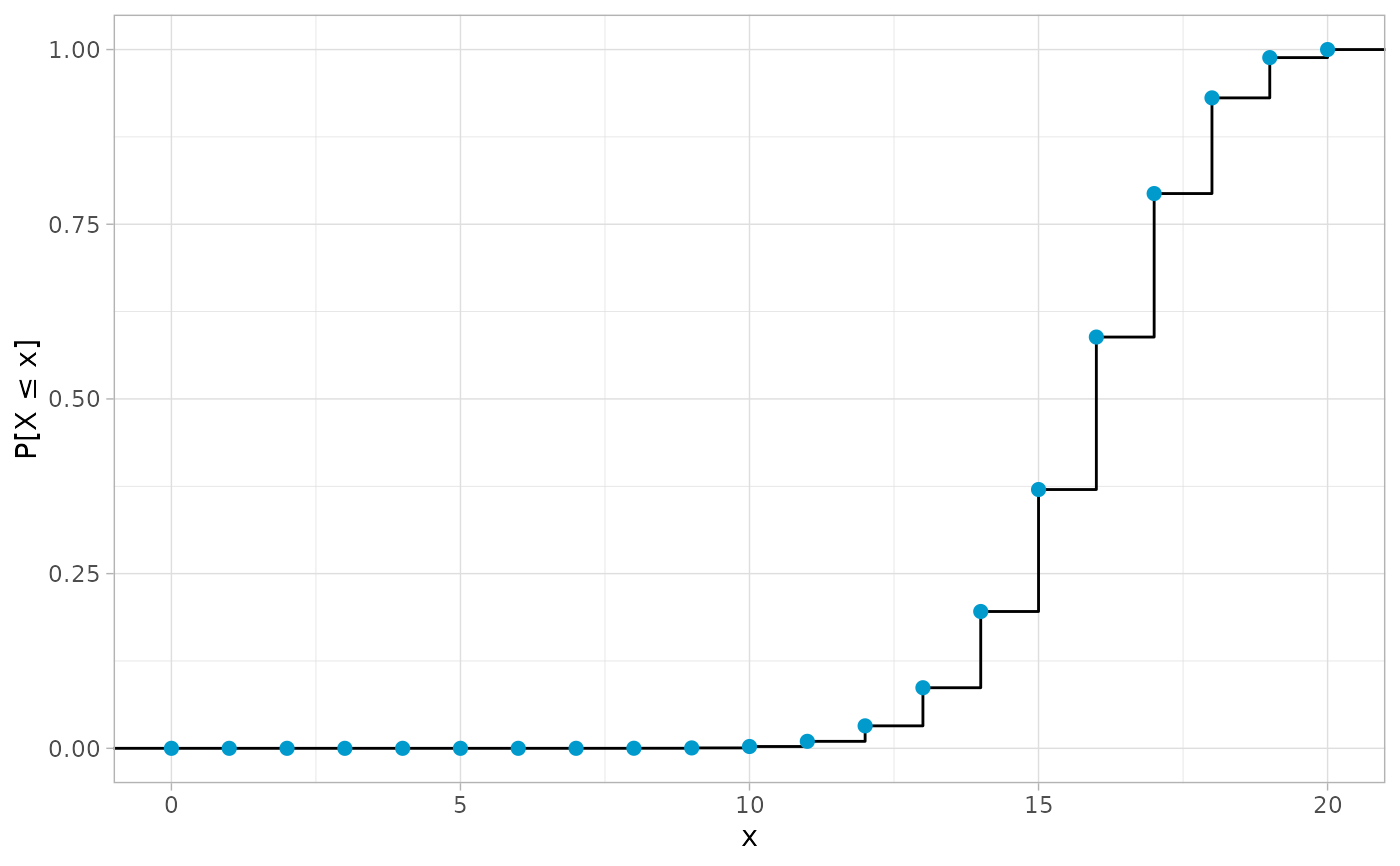
This function creates a plot of the cumulative distribution function (CDF) of
a ddf distribution.
Usage
plot_cdf(
  dist,
  xlab = "x",
  ylab = "P[X ≤ x]",
  col = "deepskyblue3",
  main = NULL,
  sub = NULL
)Details
For further details on the cumulative density function, you may consult cdf().
See also
Other plotting functions:
plot,ddf,missing-method,
plot_pmf()
Examples
# Plot the CDF of a binomial distribution
plot_cdf(bin(20, 0.8))